Carto: turn your business data into intelligence

Mapping data in your business has historically been the domain of GIS experts and has relied on complex software that takes time to learn. Strong business cases were needed to justify building applications to display data. Enter Carto: one of the biggest disruptions to the business intelligence industry yet.
Carto is a cloud based GIS system for complex business intelligence visualisation and analysis. Its powerful and open platform creates insight from location data.
Carto empowers companies to see relationships they could never see before in their data and optimise performance through a beautiful and easy to learn interface. Here are five things you can do with it:
Measure campaign success
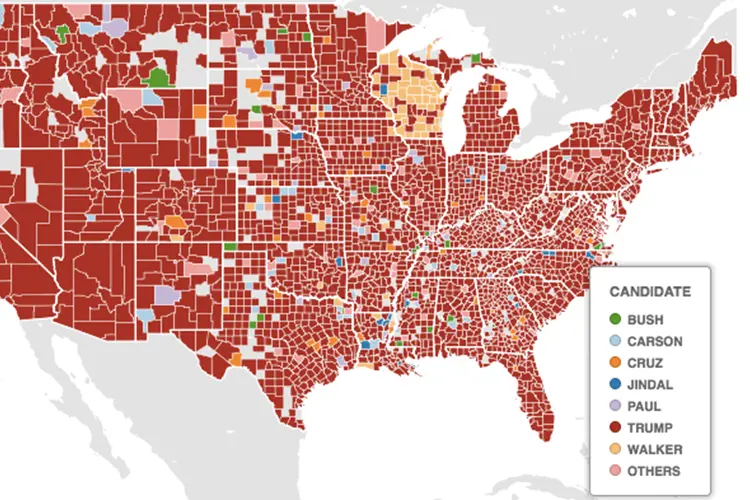
Google Trends has used Carto to devise a map of the most searched Republican presidential candidates, to measure Trump’s success.
Carto allows users without coding knowledge to access a simple, user-friendly dashboard to withdraw key insights, using location data. This data enables companies and individuals to make more informed decisions and analyse consumer trends. Data such as campaign success, whether location affects behaviour and evaluating target audiences, are easily displayed.
Visualise sales data in real time
Carto was used to analyse the sales and trends across the globe of Beyonce’s 2013 album, using geotagged tweets.
Carto allows businesses to track sales around their store locations and analyse revenue and efficiency. This software can help users transform and improve business decision making.
Interactive mapping of data trends and performance analysis
Carto has been used to map obesity statistics throughout the different states of America, useful for all industries around health.
Extensive data sets can be simplified for the user to understand trends and patterns. Through an interactive map, the how, when, where and why of data helps users visualise and measure business results against competitors or locations.
Share data information easily
GROW.LONDON used Carto to identify key hotspots for set up, relocation and expansion within London. Monitoring economic output, population growth and transport connectivity allows councils to visually map where improvements can be made in city developments.
Carto displays customer data, without investing in expensive GIS software infrastructure and coding skills. Users are able to see trends, clusters and densities of customer data across a map easily.
Tell stories through animated maps
Spotify uses Carto to provide their customers with playlists of hundreds of cities unique music trends. This interactive map allows users to experience cities globally through music.
Story telling allows user to understand social trends throughout space and time. Carto animates data in a stylised map providing simple data insights based on demographics and behaviour.
Related Articles
Here are more related articles you may be interested in.
How Satellite based Earth Observation Supports Emergency Response Teams
Natural disasters are an increasingly familiar reality, yet their unpredictability remains a core challenge. This is why preparedness is our best means of mitigating impact when disaster does occur. Satellite technology plays a critical role in enabling this readiness, but why? To understand this, you need only consider the sheer scale and diversity of Australia’s landscapes, waters and ecosystems. The continent spans 7.7 million square kilometres and, relative to its total area, has a low population density. This…United Nations, Google Cloud and NGIS Team Up to Bring AI-Powered Planning to Communities in Crisis
The United Nations International Organization for Migration (IOM), in partnership with Google Cloud and NGIS are advancing data-driven humanitarian planning through the use of AI and Geospatial powered tools, helping humanitarian organisations to analyse the most vulnerable locations across multiple areas and proactively plan for disaster response, climate driven displacement, and long term community recovery. At the centre of the initiative is the…Celebrating Women in GIS: More than Maps
From tracking deforestation to building geospatial tools from the ground up, the women at NGIS are driving impactful real-world outcomes. This International Women’s Day, we spoke to three women across our Earth Observation, software engineering and spatial analysis solutions, to find out what first attracted them to GIS, what keeps them here, and what they’d tell their younger selves starting out.NGIS joins global space-based solutions provider CLS
Media Release | 27th January 2026 NGIS is excited to announce that the company will now be part of CLS (Collecte Localisation Satellites), a global leader in monitoring and surveillance solutions for our Earth. The acquisition marks a significant milestone for the Australian geospatial sector, bringing together NGIS’ world-class geospatial expertise with CLS Group’s expansive reach and innovative capabilities in space-based solutions. Beyond technology and commercial…