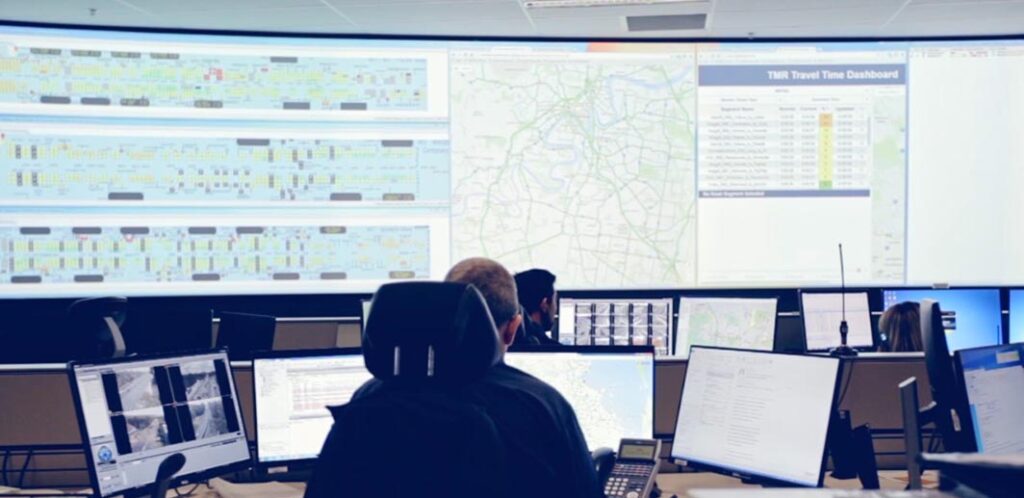
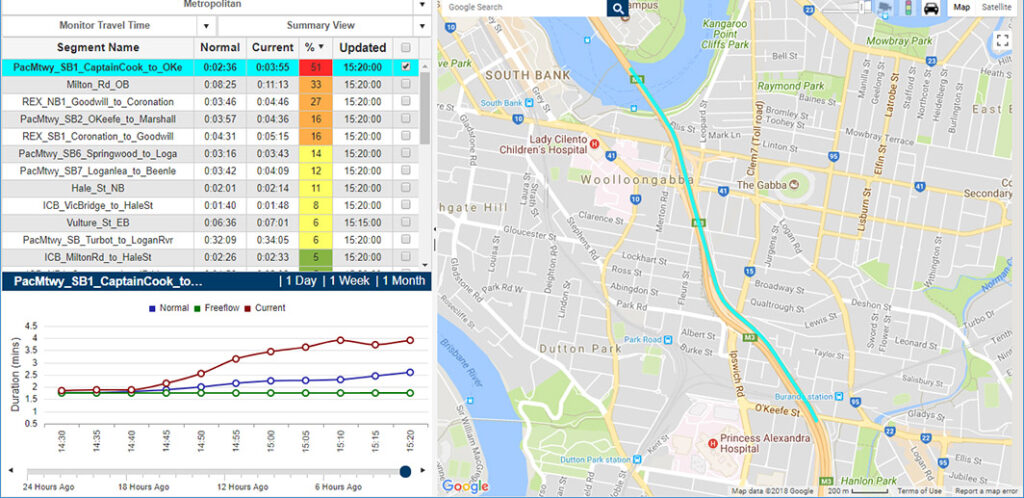
Live network congestion dashboard
Keeping the network flowing
Quickly identifying and responding to incidents on the road network, to mitigate impacts on the network and to keep traffic flowing, is of measurable importance to road authorities. The ability to quickly and effectively monitor, detect, verify, respond and clear incidents both keeps commuters moving and reduces avoidable social costs.
The Queensland Department of Transport and Main Roads (TMR) has a vision of creating a single integrated transport network accessible to everyone. A mission within TMR’s operational areas is to proactively operate the road network to support improvements in safety, reliability and efficiency and help users make informed and timely travel decisions.
TMR engaged NGIS to build a dashboard capability that gives operators a first pass view of the entire network, allowing them to quickly identify congestion.
New data, new opportunities
TMR is responsible for detecting and responding to hundreds of incidents across the road network through Traffic Management Centres and district Road Operations offices. They use a number of complementary technologies to help monitor the network to identify and respond to crashes and abnormal congestion. In this role, situational awareness is critical to be able to more quickly identify incidents.
TMR uses road loops, camera systems, partnering agencies, social media and in-field resources to assist in quickly identifying issues on the transport network. However with the emergence of new data sources, such as Google, there is potential to use these non-traditional sources to improve network monitoring capabilities.

An easy to use tool
NGIS built a travel time dashboard, using Google data, to highlight to operations staff locations where network performance is abnormal compared to normal conditions. This dashboard shows discrepancies between current travel times and expected times for configured road segments, ordered by the amount of variance compared to a normal day. This allows operations staff to quickly identify performance abnormalities that might be a result of a crash or other incident.
The dashboard complements existing systems and gives TMR operations staff access to an additional data source, with the Google Maps API reporting live travel times at 5-minute intervals across all configured routes.

Quick positive verification of incidents
The dashboard supports operations staff in monitoring the network and identify abnormalities, including getting positive verification between multiple data sources. The tool and Google Travel Time Data provides an additional information source to assist in the identification and verification of performance abnormalities on the road network, to support incident management and response services.
A benefit of the Google data is that it comes from a non-traditional source and offers different profiles of quality and coverage compared to other data and information sources. An additional benefit to TMR is that Google data helps them understand the potential value of external data sources.


