A developer’s guide to working with geospatial data

Coming from a software engineering discipline with no background in geographic information systems (GIS), I have been picking up all sorts of mapping libraries and terms since I joined NGIS over six months ago.
In today’s Geotech Friday blog, I will be sharing some beginner concepts for handling geospatial data and some of the useful data types you may encounter along the way.
Geospatial data and spatial ETL
Geospatial data is data with location information attached to it. For example, linking customers with their residential postcode or simple latitude and longitude positions of places on Earth.
Most of the time this data will be collected, cleansed, structured and stored into databases, and later retrieved through queries for further analysis or reporting purposes. In software terms, this is called an ETL (Extract, Transform, Load) pipeline process.
To make storage and transmission possible, there needs to be an agreed-upon representation format to ensure there is no misunderstanding between people and software. This is where the geolocation file format and a variety of specifications come into play.
(source: https://xkcd.com/927/ )
Why do we need specifications?
All jokes aside, specification defines specific ways to encode geometry and sometimes its associated attributes, while reducing the features into something that can be described by text. The text will then be translated into bytes and understood by computers.
Before diving into some of the different encoding schemes, first we have to understand the building blocks of geospatial shapes. Although it might appear to be complex at first glance, spatial objects can actually be constructed with simple math concepts; points and vectors.
The term “vector” in the next section refers to the mathematical vector, not the GIS vector, see below diagram for the comparison.
(source – left: Ducksters. (2021). Physics for Kids: Basic Vector Math. Ducksters. Retrieved from https://www.ducksters.com/science/physics/vector_math.php)
(source – right: Chapter2_GIS_Fundamentals by University of Massachusetts Amherst http://www.geo.umass.edu/courses/geo494a/Chapter2_GIS_Fundamentals.pdf)
How to represent geospatial objects
2D Points or coordinates are typically represented by (x,y) – or a (longitude, latitude) pair. Vectors are instructions about how the dots should be connected to form a shape.
With points and vectors we can derive shapes such as:
- Lines – by linking the points.
- Polygons (area) – if we close the line by repeating the last point in a line.
These two primitive shapes can be further combined to form:
- Multi-points – lots of points
- Multi-lines – lots of lines
- Multi-polygons – lots of polygons
- Feature collections – a mix of point(s), line(s) and polygon(s)
(Image credit: the geometry images comes from Wikipedia, https://en.wikipedia.org/wiki/Well-known_text_representation_of_geometry )
Standards
The most commonly used standards or representations include, but are not limited to:
- Well known text (also known as WKT)
- GeoJSON
- Shapefile
- Geopackage (also known as GPKG)
Well Known Text
WKT is the string representation of a geometry object. It was introduced and published by OGC (Open Geospatial Consortium) and ISO (International Organisation for Standardisation) some time ago.
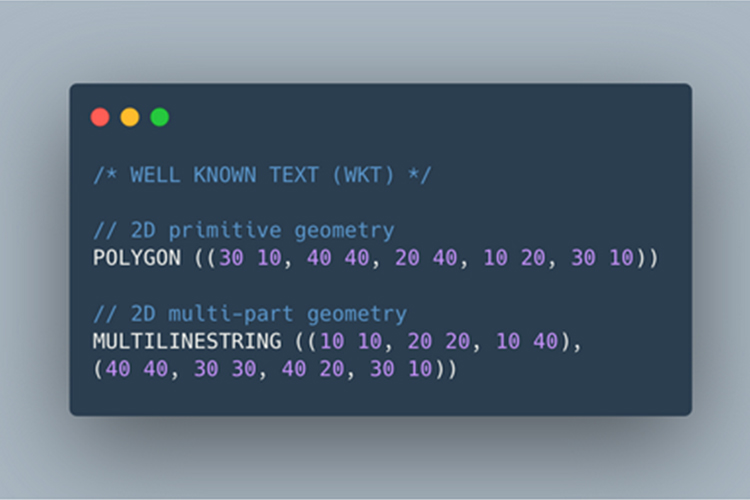
WKT defines a shape by stating its type, followed by the coordinates. A more compact version of WKT is called Well Known Binary (WKB). It sacrifices readability by encoding data in a hexadecimal string in exchange for being quick to process by a computer. It is worth noting that WKT only contains location information of the shape, but not the attributes related to the shape.
Example of WKT:
GeoJSON
A GeoJSON represents geometry in a JSON-like structure. JSON (JavaScript Object Notation) is a text-based data-interchange format that’s been used in various programming languages. It wraps a collection of key-value pairs inside curly braces,
which usually denotes an object. The “properties” key makes it possible to store related attributes along with the shape (make it a feature rather than pure geometry). GeoJSONs are popular within the GIS industry, as well as the software industry, and are widely supported by databases and mapping libraries.
Example of a GeoJSON:
Shapefile
Apart from geodatabases, a Shapefile is another way to store geolocation features. The Shapefile format was developed by Esri (the software company that makes ArcGIS) in the late 90s. Shapefile breaks down the parts into multiple files with different extensions.
When it is zipped for transfer, it is important to include all the bits and pieces of the Shapefile, not just the ones that end with .shp
- .shp is for the geometry of the shape
- .dbf is for the attribute
- .shx is for the index (not quite related to the shape itself, but it helps the database to search for the shape if a huge number of records exists)
Example of a Shapefile that appears in ArcCatalog:
(source: https://desktop.arcgis.com/en/arcmap/10.3/manage-data/shapefiles/what-is-a-shapefile.htm)
GeoPackage
In comparison to the long-lived Shapefile, GPKG is a rising star among the open source community. GPKG is an open, platform-independent data format that relies on SQLite (an on-disk, lightweight database) as its storage container. It supports both raster and vector data, and has the benefits of being portable, easy to read and write, efficient to transfer (one ready-to-use single file) and suitable for mobile application.
If you’d like to see GPKG in action, here is a video by Klas Karlsson on basic file operation and creating shapes and layers in QGIS with GPKG format.
So far we’ve walked through four common GIS standards. If you’re interested in learning the comparison between those formats, Terramonitor, a Finnish GIS company, has a great comparison grid in their article Shapefile vs. GeoJSON vs. GeoPackage.
What’s next?
With these formats on hand, the next question is – how are we going to manipulate them to make these shapes do something useful? There are a couple tools we can use to do this.
Visualisation
To display points, lines and polygons on the map, we first need to choose a mapping library. Then we need to find a converter library (or write it yourself) to translate between what you receive (e.g. from a database or an open dataset) and what you need to feed to the map.
For example, for an application written in Javascript language we have:
- Google Maps – Paid service. Google Maps comes with a rich collection of associated services such as satellite image and street view.
- Mapbox – Paid service. Known for good support for style customisation.
- Leaflet: Open source, quick to setup and good for creating a simple map
- OpenLayers: Open source
- Cesium: Can visualise 3D terrain, buildings or even the Earth!
I have worked with the combination of Google Maps and WKT. Since Google Maps doesn’t provide native support for WKT, we used this library called Wicket to do it for us. With a couple lines of code, we parse in a WKT string, and the shape can be visualised on the map.
Analyse geospatial data and shapes
Sometimes we need to do more complicated operations with the geometry and shape attributes, such as compute the centre of a polygon, find the places within several km of a given point.
These computationally-extensive tasks are best performed in the database directly. Here are a few options:
PostgreSQL + PostGIS extension
PostgreSQL with PostGIS extension is our go-to when it comes to relational databases. It comes with heaps of spatial query functions. Read the spatial function documentation here.
MongoDB is a popular no-SQL, document-based database with the advantage of being easy to scale and flexible. Watch this short tutorial on DEV Community to get you started with MongoDB spatial query.
If you are into programming like myself and want to experiment, there are a couple of great Python libraries to try out (list kindly suggested by my colleague, Stafford):
Food for thought
- Getting started with configuring a spatial enabled database? Read Chapter 4. Using PostGIS: Data Management and Queries. This PostGIS documentation covers spatial reference system for different projection, creating spatial tables and register geometry columns.
- Spatial indexing speeds up data fetching when dealing with large datasets. Learn more about how spatial indexing works and how to add it to your spatial table here.
- Beyond Lat Long: Geometry / Flat Shape v.s. Geography / Spherical shape. When it comes to calculating the distance between coordinates, it’s important to take the shape of the Earth into consideration. In this article by PostGIS, you will learn the difference between the two, how to choose the appropriate coordinate based on the requirements, and how to convert between coordinates in the PostGIS database.
- Not so familiar with map projection? Here’s a fun YouTube video introducing various projection methods, their characteristics, and usage – Why all world maps are wrong.
- What if there is a hole in my polygon? Here’s a comprehensive introduction about GeoJSON and how to deal with holes in the shape, written by Mapbox contributor Tom MacWright – More than you ever wanted to know about GeoJSON
- GeoJSON Playground web application http://geojson.io and some datasets to experiment with http://geojson.xyz.
Interested in pursuing a career in GIS?
Are you a graduate developer based in Perth or Sydney? If you are, check out our careers page for open graduate positions! We are looking for people who bring ideas to the table, aren’t afraid to take initiative and care deeply about our values and philosophies.
If we don’t have a role available that you’re looking for, fill out the expression of interest form and we’ll get in touch when there’s an opening.
Related Articles
Here are more related articles you may be interested in.


